
Hello World!
This week is a week filled with code and debug. Based on previous research, we decided to focus on the Galaxy Zotero Group and do hands-on experiments after discussing with Bertram. Following is the process to achieve our first goal: explore tags distribution.
Data Collection
The way to get the data is not easy for me since Galaxy Group uses a little strange JS infrastructure to build the website, which means it is not easy for code to capture the real data source. But finally, I got it! By using the Chrome Inspector, I found the API and then got the data I want. Meanwhile, it is necessary for us to send an email to the Group asking for permission to use the data for research.
Data Summary: this data contains 7754 Rows and each row means a paper related to the Galaxy Project. Furthermore, there are 26 attributes in the datasets, including paper title, paper type( journal/ conference….), creators (authors), abstract, dot, tags, etc.
Data Cleaning
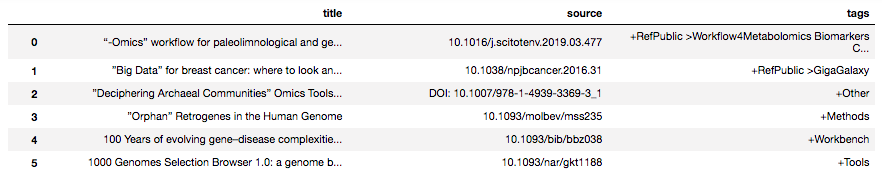
After collecting the raw data, the next step goes to data cleaning. Since our goal is to explore the tags distribution and paper content, column “paper_title”, “DOI” and “tags” are extracted from the raw data.
Explore “tags”
Summary Columns “tags” is a highly interesting part for us because it contains keywords related to provenance research, for example, “reproducibility”. The project objective is to find out the current usage of provenance tools in academia and this column is a good point to start with. Furthermore, “tags” contains manually added ones and those automatically generated by Zotero, which is also attractive for us to dive deeper.
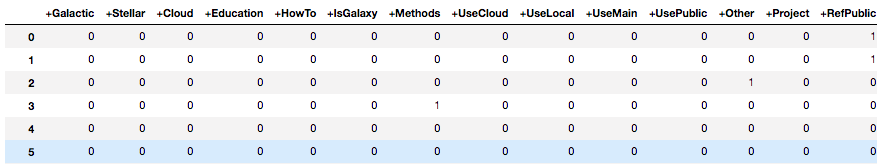
Data Transform Column “tags” could be retreated as categorized data. For further analysis, here this column would be transformed as a metrics and each tag would become a column in the new dataset. The value of each cell shows whether this paper contains this tag (value =1) or not (value =0).
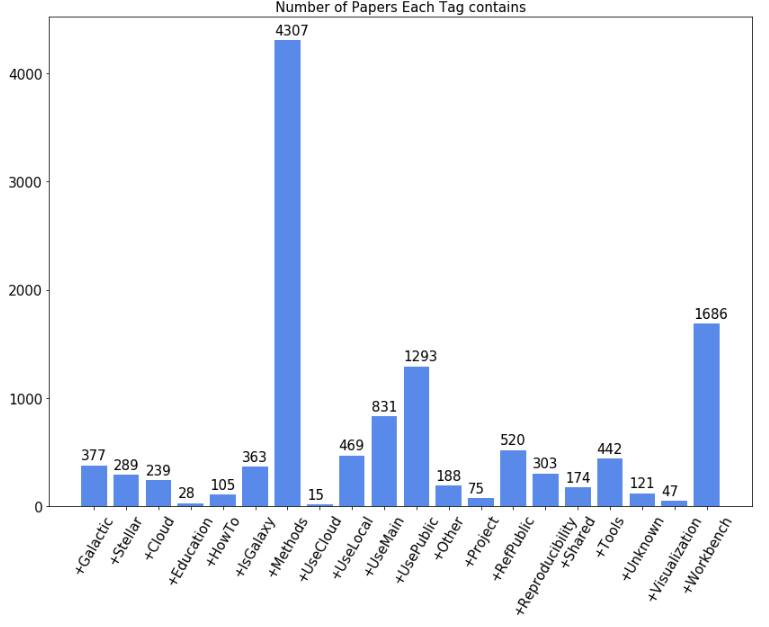
Tags Visualization and associate rules After getting the transformed data metrics, it is easy to generate histogram and show the distribution of each tag.
Based on the previous discussion, association rules between each tag becomes another goal for us to achieve and the result is shown below.
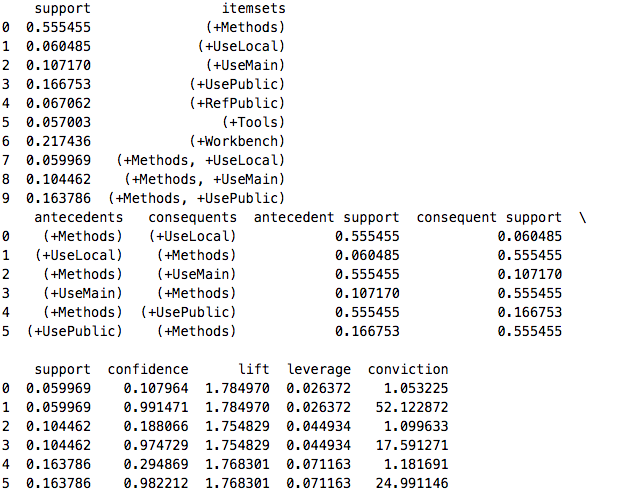
We can see that the relationship between tags “+UseLocal” and “+Methods”, “+UseMain” and “+Methods”, “+UsePublic” and “+Methods” are strong. But no further meaning behind these relationships, which means more operations and algorithms should be launched to dig out useful information.
Hope you all have a good weekend.