This week I worked more with the user’s side of interactivity with the GUI. I added features such as being able to make real-time changes to the graph in a tab interface as well as scroll through the image.
I had to implement an algorithm for the Tab Widget of the GUI since the only functions that the Tab Widget’s library includes are access to the current Tab as well as an index’s objects. Because the tabs enabled closing and moving there were a lot of inconsistencies that I had to consider. I used a hash-table to reference each of the objects by graph name that the tabs were rendering. In addition to this, within the hash-table I created a numbering mechanism so that the next graph rendered would be numbered the next lowest number that has not already been used. There was a lot of debugging involved as there are a lot of widgets and objects that have to be dynamically created with each new tab.
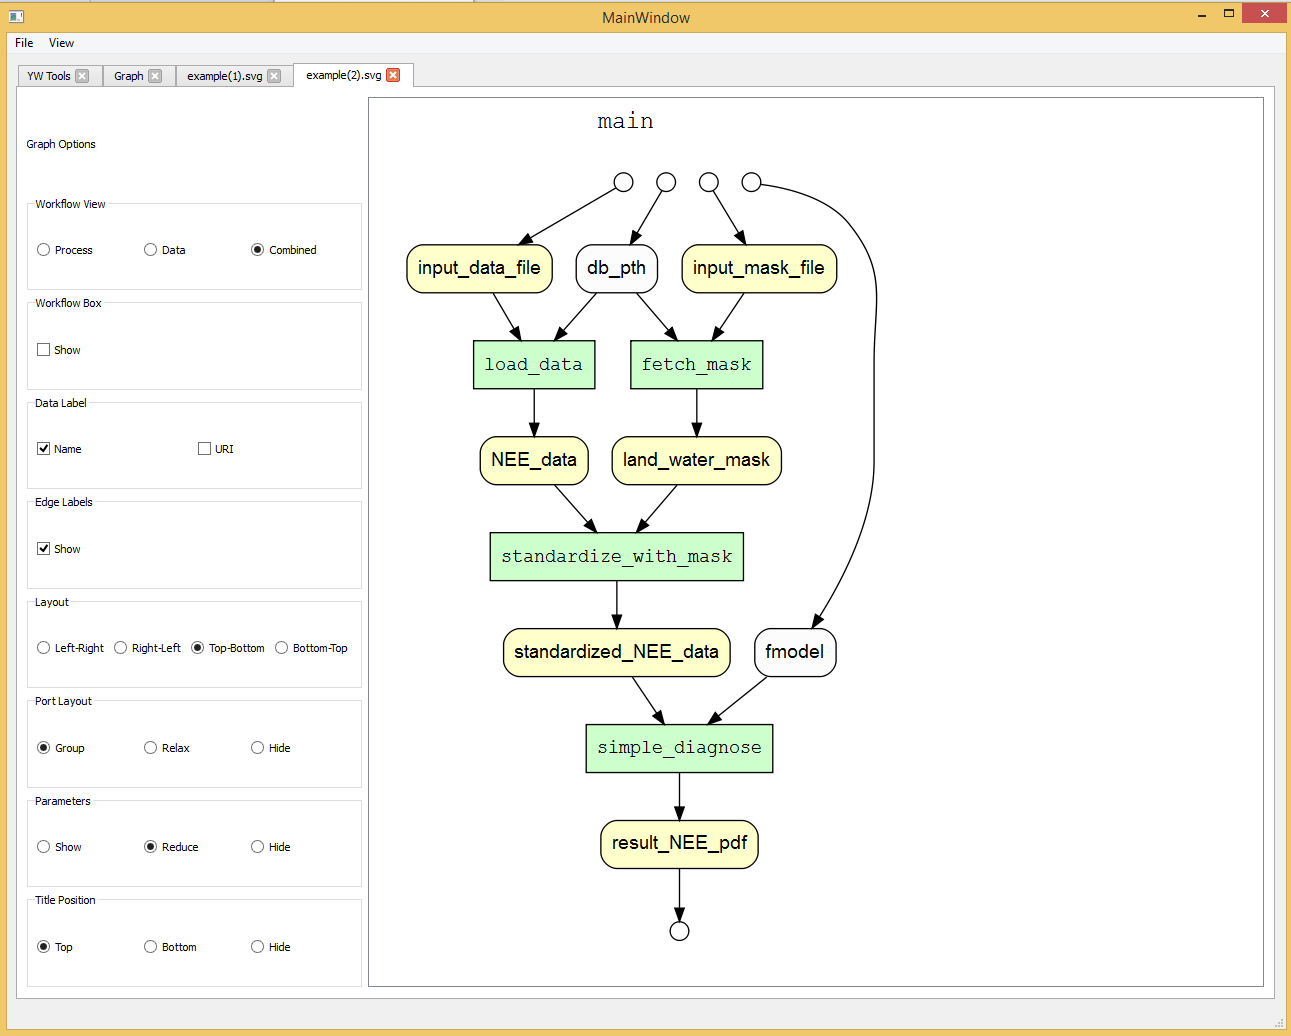
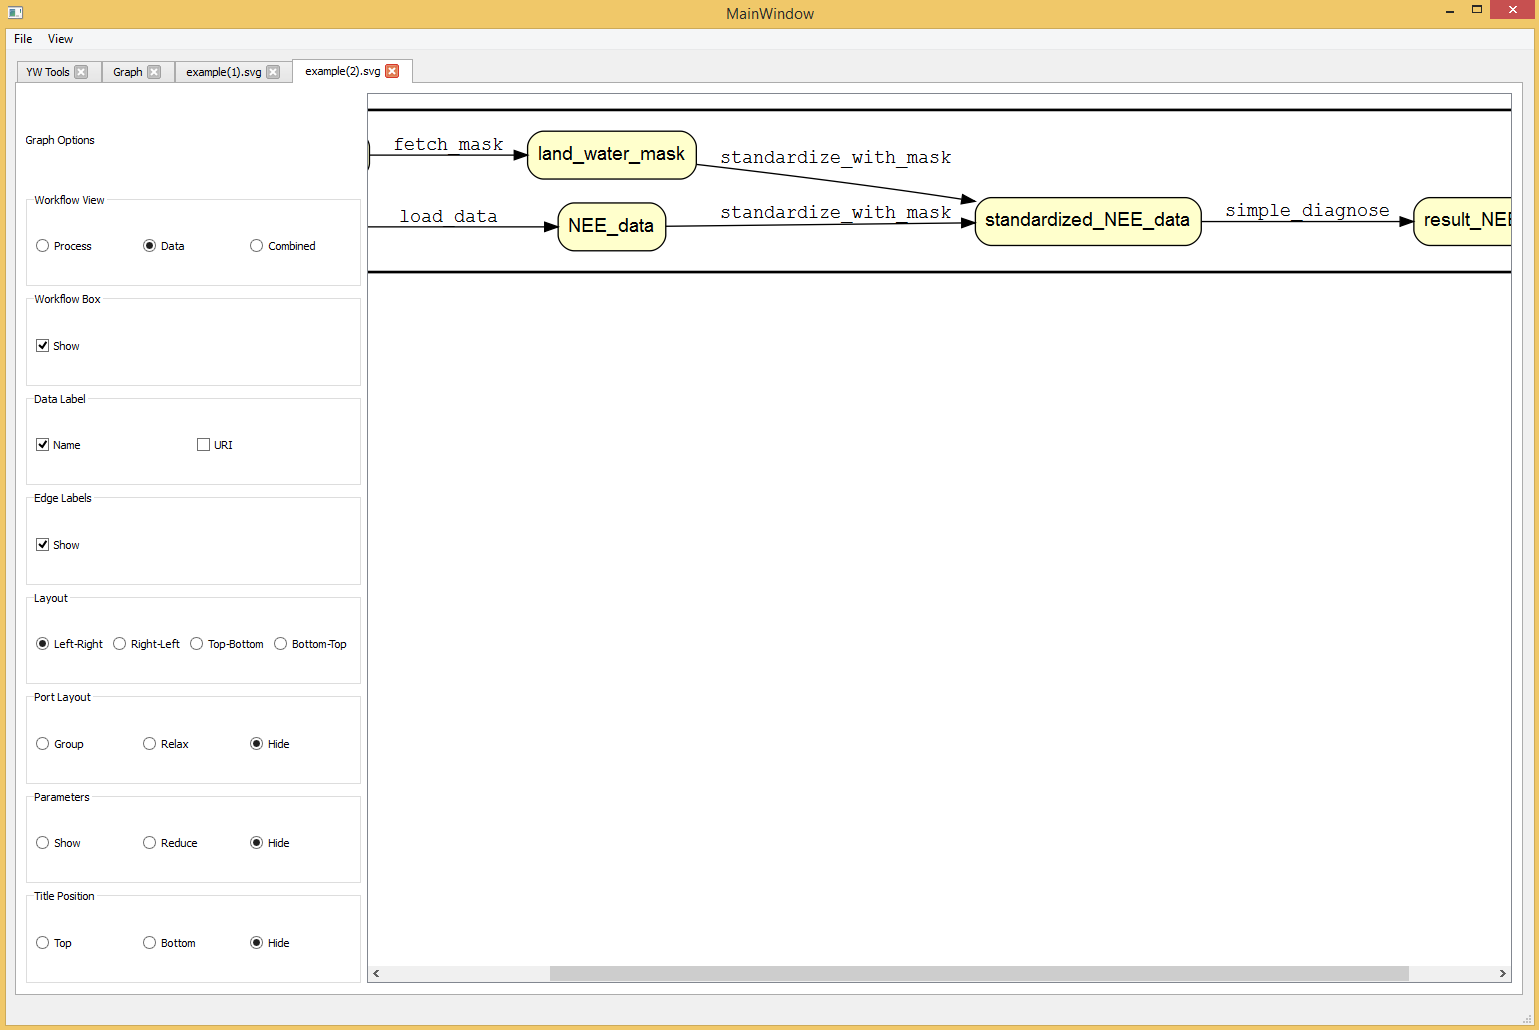
With a new tab addition, I had the options selected for the graph that were selected from the graph interface. In other words, whichever options the user uses to select the graph, will be pre-checked on the rendering page.
I changed the rendering mechanism for the graph files and instead display them through a WebView Widget, which will allow responsiveness to the user in the future. I plan to register clicks and commands within the images this upcoming week, which I have discussed with my mentors. Below are some of the images of the new graphing tabs that enable real-time updates. I also want to enable zooming of the images as well as a double-click mechanism that will center the graph since the graph view right now is a bit undesirable.