
Welcome to the seventh installment of Project 2: Supporting Synthesis Science!
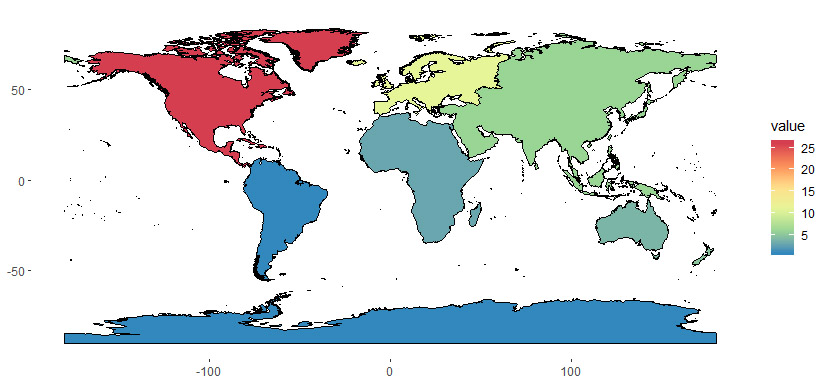
First, I neglected to include in last week’s blog one of the nice plots Rob made to display the characteristics of our set of data-aggregation studies. This one is a map showing how the number of papers breaks down by continent:
At the end of last week we’d concluded that revising our data accessibility rubric for individual data sources (within each data-aggregation study) was critical to the accurate assessment of researcher citation practices. To this end, Rob and I dug back into each data-aggregation study to determine if Digital Object Identifiers (DOIs) were available for each source’s citation in reference/literature cited sections. This proved to be an unexpected education in approaches employed by individual journals. As has been our experience in submitting manuscripts, many journals now require DOIs to be included in each citation, while many other journals require citations without DOIs. Still others link DOIs to citations as a URL (during production of online-available pdfs) without actually printing the DOI. Others go a step further by linking non-DOI citations (e.g., reports, theses) to a Google Scholar URL using the author name, year, and title. We were surprised to have not seen this before, but these Scholar links sometimes took us directly to the paper of interest. More often, however, we were led to a Google Scholar citation (which looks like a citation, is not linked, but links to other citing papers) or to nothing at all. The outcome of this process was the shifting of the recorded accessibility of many articles (that were not linked) from a distance-to-data value of 2 to a distance-to-data value of 3. Overall satisfying was the resulting distribution of distance-to-data values (range = 1-4, with 1 being a direct link to a data source and 4 being an inaccessible data source [e.g., a personal communication]); instead of a bimodal distribution peaking at 2 and 4, instead we had unimodal distribution peaking at 3.
Once we were satisfied with these updates, we began the process of repeating and revising our modeling steps initiated last week. Following updates to the distance-to-data values, we initiated two ordinal mixed-effects models (aka cumulative link mixed models) using distance-to-data as an ordinal response. The first considered all data sources employed in data-aggregation studies (n = 505) with a focus on potential differences in distance-to-data values between years of publication and between data-aggregation studies conducted by NCEAS-associated researchers and studies identified with a systematic search from Web of Science. The second considered a subset of these sources, employing only those records where the source had a publication year associated with a citation. This removed an sources that perhaps were uncited or were linked solely with a URL in the paper. From the publication data, we calculated a “data age” index by subtracting the source’s publication year from the citing data-aggregation study’s publication year. The distribution of this response alone was interesting, with one source 111 years old (median = 6 years). This data age covariate exhibited a strong positive relationship with distance-to-data with older sources having higher values than younger sources. We are continuing this pursuit with further refinements to our source data set and will also be examining characteristics of data-aggregation studies such as whether authors archived their resulting data in repositories.