
Greetings!
This week I dug a bit deeper into the citation data, created some additional visuals, and looked into some tools to scrape mentions of DataONE on the web. (I refer a lot to “citing” and “cited” articles in this post so here’s a clarification: citing = all articles that have cited a DataONE article, cited = a DataONE article (i.e., a Library 1 article in Zotero).)
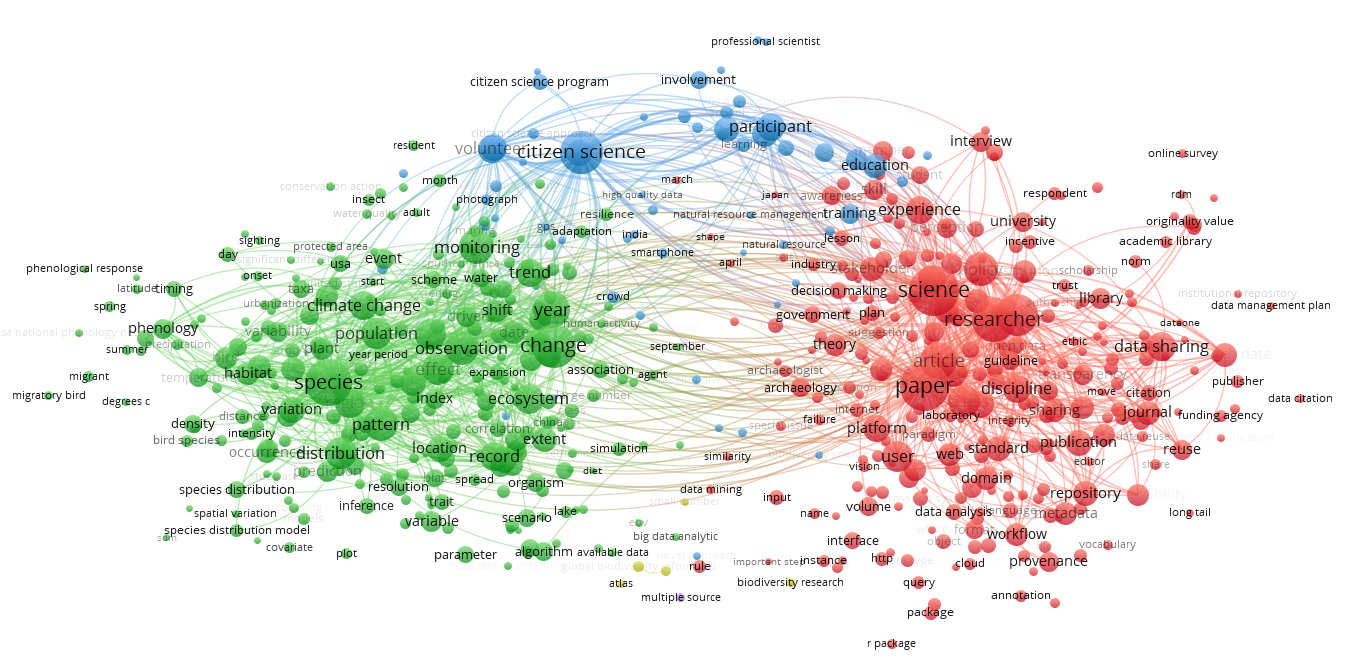
With VOSviewer I used a text corpus of all the titles and abstracts of the articles that have cited DataONE articles and mapped their keyword co-occurrences. Based on this analysis there appears to be be three main areas of concentration of the citing articles: Ecology, citizen science and data sharing/management. This was based on the citing articles that are currently available in Web of Science (WoS).
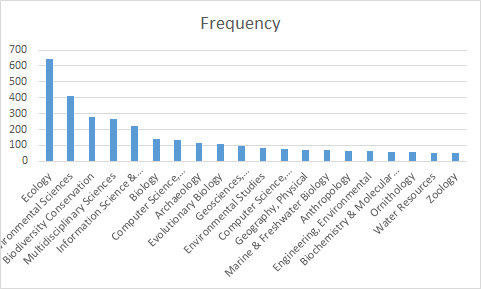
Next, I used Bibexcel to look at the frequency of subject categories of the citing articles that were available in WoS. This provided a further breakdown of subject areas that cited DataONE articles are reaching. The majority are coming from ecology and various life sciences fields or a technological field such as computer science or library information science.
- Ecology 644
- Environmental Sciences 414
- Biodiversity Conservation 278
- Multidisciplinary Sciences 265
- Information Science & Library Science 219
- Biology 141
- Computer Science, Information Systems 131
- Archaeology 112 Evolutionary
- Biology 106
- Geosciences, Multidisciplinary 99
- Environmental Studies 82
- Computer Science, Interdisciplinary Applications 77
- Geography, Physical 74 Marine & Freshwater Biology 71
- Anthropology 65
- Engineering, Environmental 63
- Biochemistry & Molecular Biology 58
- Ornithology 57
- Water Resources 54
- Zoology 53
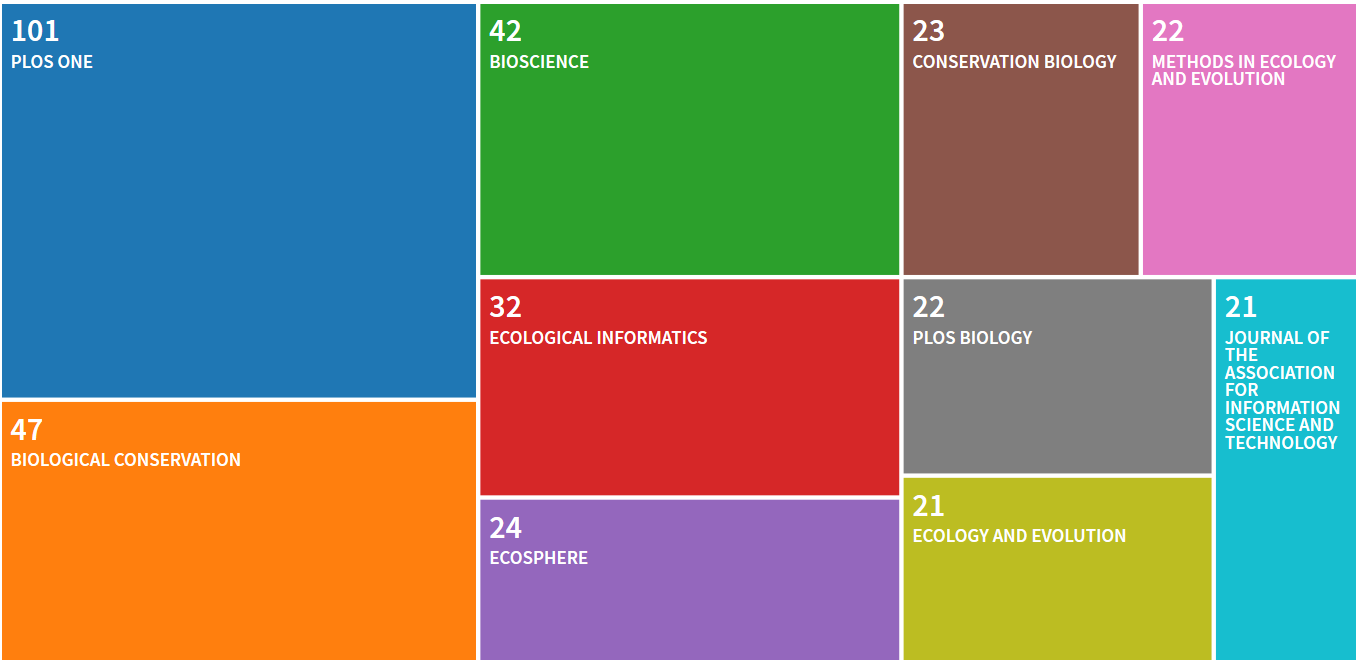
WoS also has some useful visualization tools based on citation data. The visual below is a tree map of the top 10 journal titles of all the citing articles.
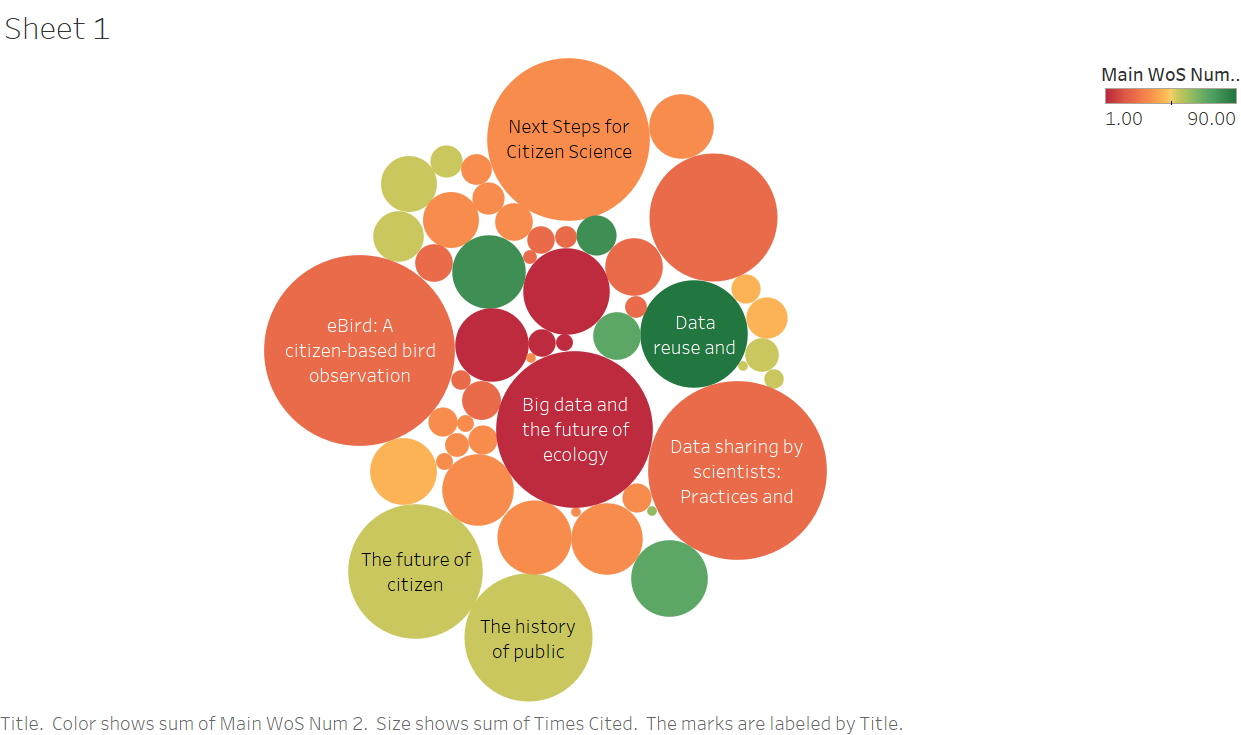
I also utilized Tableau to create a visualization of cited articles, color coded by the theme of the citing articles, and sized according to times the cited article was cited by the citing articles. I plan rerun this map sized according to the impact score I calculated last week instead of times cited to take into account Altmetrics data rather than just the amount of times the each article was cited.
I switched gears a bit in the middle of the week to tackle web scraping mentions of DataONE on the web. I created a list of approximately ten tools that can be used to extract data from a Google Search into an excel file for further analysis:
- Web Scraper
- Webhose
- Python web scraping with Scrapy and Beautiful Soup
- R web scraping w/ rvest
- Google Sheets web scraping
- Method 1: https://medium.com/coriers/web-scraping-with-google-sheets-20d0dce323cc
- Method 2: https://www.authoritylabs.com/data-collection-with-google-spreadsheets/
- hiQ
- Octoparse
- Apify
- Outwit
- Google Search API
- Data Miner
The purpose of this task is to understand the audience that the web page mentioning DataONE is targeted towards, the context / type of mention DataONE receives, and, if linking, where in DataONE it links to. Right now, Data Miner seems promising, but necessitates additional exploration to determine if it will meet our needs. I lament that I do not have more advanced programming knowledge as this task would be much easier and customizable with Python.
At the end of the week, I started working on a way to visualize all the cited articles and citing articles in one citation map. Surprisingly, I cannot find a way to do this with VOSviewer or Bibexcel and am having to learn how to use Gephi to create the network map from scratch. I’m hoping my colleague, Audrey from the DataONE network analysis project, will be able to provide some pointers to expedite things.