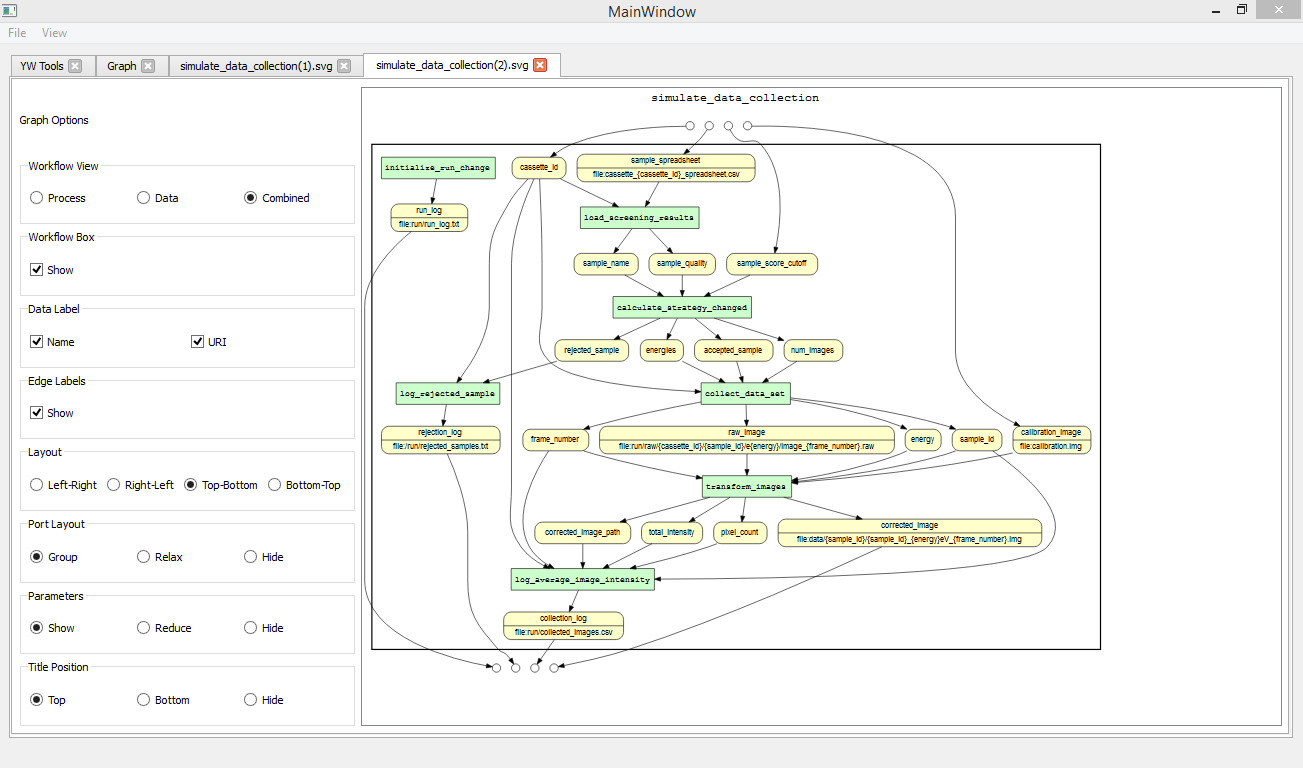
This week I had a presentation with a few Biology researchers from UIUC. I would be presenting the GUI I have created so far after the Yes Workflow team presented our project to several researchers who are interested in working and displaying their own scripts into workflows. Although having been on the team for nearly 2 months now, I learned a lot during the meeting about Yes Workflow, such as the motivation behind it, the several uses for it in the future, as well as hearing some researchers talk about some of the advantages it could provide them.
Aside from the presentation, I worked with updating rendered graphs in the GUI once the Watchdog detected an update within scripts from the local directory. The Watchdog API would look only at those files that have been processed through Yes Workflow and once a modification had been made to a file, the graph would be re-rendered. In addition to this, I added functionality to zoom in and zoom out of the graphs that have been rendered so that the user can have a more optimal view of their workflow scripts.