
Next week marks my last as a summer intern, I plan to post my final products in next week’s post. For this week I thought I could reflect on the somewhat unexpected things I was able to take time to learn during this internship. A number of the graphics you have already seen, but as I am going to describe how I developed them, it seems more interesting to have the end product as an example.
Methods and Software for Personal Development:
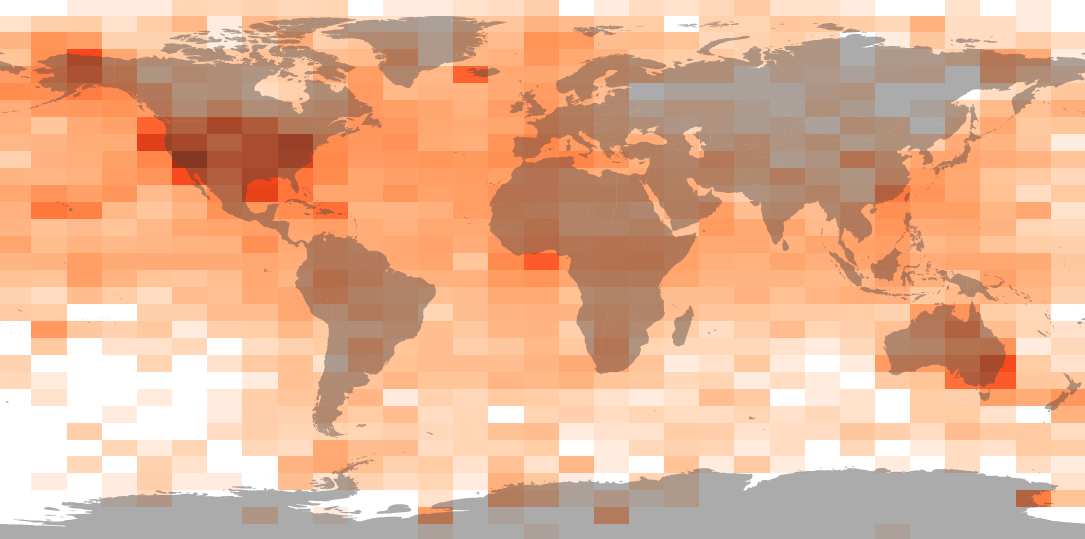
The graphics package “ggplot 2” in R <- Most of the graphics I have built for the outreach materials were put together using ggplot2(). This is a graphics package in R that I have wanted to spend some time getting to know better. One product that came from this was the HeatMap of data accessible through DataONE. In the future (if Ed Flathers figures out the code to properly pull JSON files with X, Y, Z outputs) I’ll be able to completely automate it. As for now, the heatgrid is generated using ggplot2, it is automatically updated in Adobe Illustrator where it layers with a map, and from there I can save a new version, where it is then auto updated in the InDesign outreach files. Messy, but still relatively automated.
Something like this:
 –>
–>  –>
–> 
A smattering of other R packages <- In my projects collaborating with Ed Flathers I had a chance to use “wordcloud” and “circlize.” These packages are for demonstrating commonly used words and visualizing relationships in a network, respectively. The end products of these were two wordclouds, one of search terms entered by users in the search tool and one of abstracts held in DataONE’s collection of metadata (the abstracts were heavily edited for “stopwords,” words that are not likely to be searched by users: the, and, DOI, 362, etc). And with circlize() we ended up with a network of relationships that formed when two Member Nodes were downloaded from during a single session.
wordcloud()

circlize()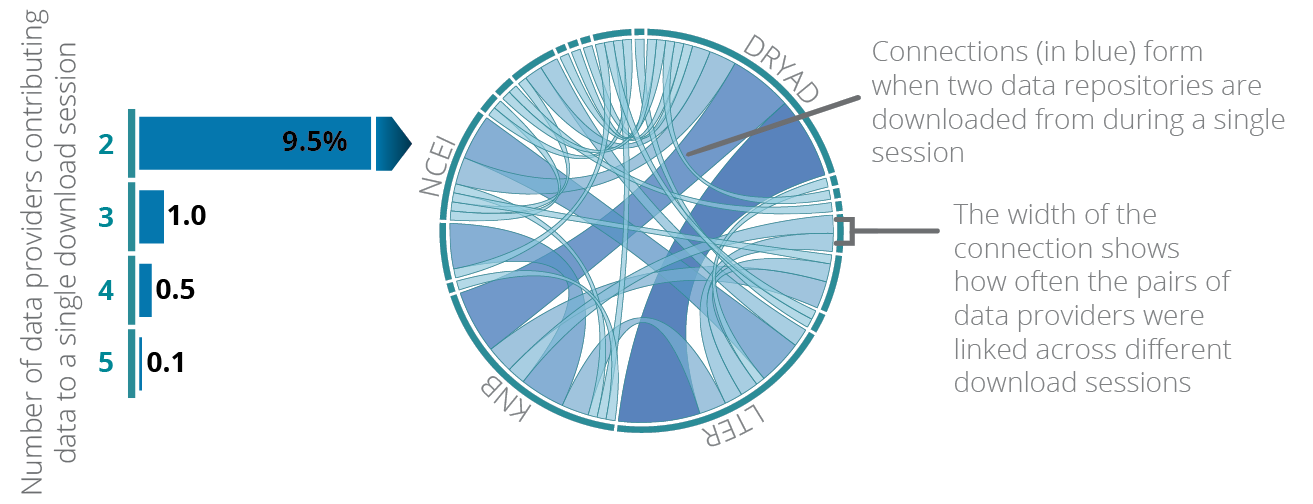
Adobe InDesign <- I have experience working in Photoshop and Illustrator, but have never had a reason to spend time learning design layout with InDesign. As part of my internship I did (most of) a short online tutorial for using InDesign (Thank you YouTube ->TastyTuts). Almost every skill I learned in the tutorial I used in developing the outreach materials, and in the future it will change the way I develop anything that combines Layout with Graphics. I would like to spend some more time getting to know these programs, but I now have a much better understanding of the intended use of these three Adobe programs, and how they interact with each other. Something I did not have practice with before.
Infographic development <- Instead of a poster for the All Hands Meeting (AHM) in August, describing all of the parts of my Summer Internship, I am working on an Infographic that may be more useful as an outreach product for DataONE. The big difference between my internship and the other data science interns, is that my products are obvious, visual and easily printable. And at the AHM I will have some examples of each two-pager printed for folks to see.
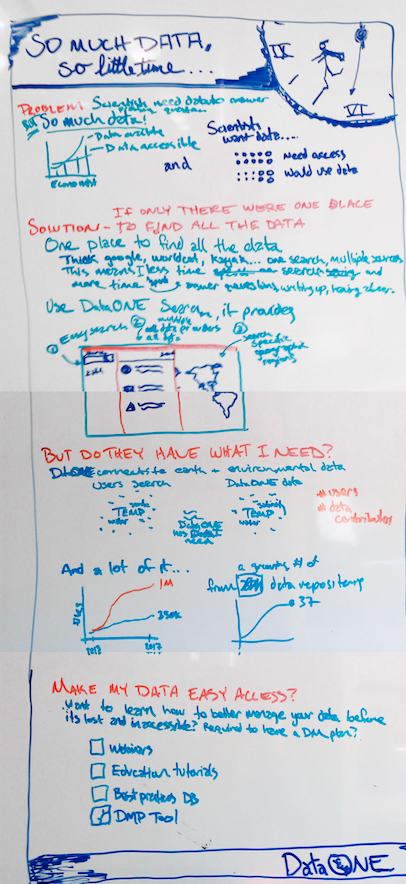
Since everyone will already be able to see what I did with my summer, I spent some time learning the difference between a poster and an infographic (check out ColumnFiveMedia if you are interested). Namely an inforgraphic is intended to target a very narrow audience, and have one single question answered, using an obvious theme and creative layout and copy. A poster, at least one developed to describe the internship, is more of a “what did I do with my summer” blurb of everything done, rather than the narrowed focus of the infographic. Here is some Skamp (this is a new word for me too, it’s just design speak for the brainstorm draft you layout on paper or a whiteboard) of my infographic ideaing.
Webtools <- A few examples of websites that I have found invaluable in developing these products: The Noun Project for developing icons, ColorBrewer for color selection (developed for maps and use in R), GitHub for accessing DataONEs shared files. I hadn’t used GitHub before this, but now have it linked up to RStudio for easy access to all of Ed’s files. Thanks Ed!
And that’s it for the week, hope you are all enjoying the end of things.
Megan